It Works: A (Very) Simple Visualizer
In this post I’m going to create a basic music visualizer based on beat detection. First I will install an audio API called JACK, then I’ll write a JACK program to detect beats in music being played, setting the stage for more complicated visualizations. Here’s a video of the end result that my friend Ryan Po helped me record - you can see that the printing of 1s and 0s is synced somewhat to the beat:
Installing JACK
The Raspberry Pi comes with a version of JACK that needs to be uninstalled first. This is because the preinstalled version doesn’t work when the Pi isn’t running a desktop environment. To uninstall JACK, I ran the following commands:
I also had to check for and remove the files /usr/local/bin/jackd and /usr/local/bin/jackd.
The next step was to reinstall JACK. First I ran the following command to install necessary dependencies:
Next I cloned, built and installed JACK2 by running the following commands from /home/pi:
Setting Up PulseAudio for JACK
By default, JACK doesn’t play nicely with PulseAudio. To fix this, I edited /etc/pulse/default.pa. There was a comment in the file that said Load audio drivers statically, followed by a bunch of lines with load-module commands. After the last of these load-module commands, I added the following load-module commands:
Here’s the breakdown on why this fixes things: PulseAudio works by connecting audio sinks and sources. Chrome for example could be an audio source, where as a headphone jack could be a sink. On the other hand, JACK works by connecting input and output ports. Chrome would be an output port, and a headphone jack would be an input port. By adding JACK as an audio sink and source to PulseAudio, JACK is effectively run on top of PulseAudio, instead of as a competitor.
Testing JACK
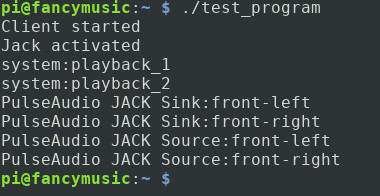
To test JACK, I compiled and ran a JACK program to output system ports. In headless mode I first ran the following command:
The command jackd starts JACK in the background. The flag dalsa tells JACK to use ALSA as the audio driver. All of the flags after this are specific to ALSA. The flags r44100 p1024 sets the sample rate to 44100 with data sent in chunks of 1024. The last flag, n2, sets the latency of alsa to two chunks of data - the minimum. More options for running jackd are available on the jackd man pages.
Next, I wrote the program first_test.c available here. I compiled the program with the following command:
Then I ran the program; outputs may vary, but this is what I got:
Running JACK on Startup
To start JACK automatically when the Pi powers up, I made some changes to the file auto-bt.sh. Here’s the top of that file before the changes: Here’s the top of the file after the changes (the full changed file is here):
The only difference is that now before PulseAudio starts, JACK is given some time startup. There is probably a better way of knowing when JACK has started than to wait 10 seconds, but I’ve gone the waiting route for the sake of simplicity.
Writing the Visualizer
The visualizer I wrote simply checks if the volume of a chunk of data is above a certain threshold, and if it is, prints out a line of ones, instead of a line of zeros. The file is rather long, so I’ve linked to the full file here, and I’ll just go over the most important bit of code, the process method - every time new audio data comes in, this is the method that gets called:
Once input data is retrieved and copied over to be played from the speaker, I simply sum the squares of the audio data points, and test if that total has gone over 0.3. I squared these values because originally, I wasn’t sure if negative values were possible, and large negative values should also be counted as loud.
Note that on line 26 of this snippet I’ve commented out a print statement to print what the total actually is. At first only zeros would get printed - the threshold would never be passed. So I wrote that line to get a ball park estimate of what a good threshold would look like. Most totals were around 0.003, so I settled on that value as a threshold.
Final Steps
In order to compile the visualizer, I ran the following command:
Then I restarted the Pi, waited a bit, connected my phone, turned on the music, and ran the program.
What’s Next
I’m pretty happy with how things are turning out - the visualizations aren’t perfect, but there also weren’t any significant bottlenecks or rough edges. So in the next post, I’ll expand the visualizer - I’ll move to LED lights rather than printing text on a screen, and consider more complicated beat detection algorithms.
| Back to Project |
Get occasional project updates!
Get occasional project updates!