Pulsing Lights: Adding LED Strips
In this post things get pretty cool - I’ll add an LED strip to the project, and change the beat detection to be much more accurate. I’ve included a parts list at the end.
Hooking up the LED Strips
Below is a diagram of how I wired up the LED strip. You can find the Pi’s pinout at pinout.xyz.
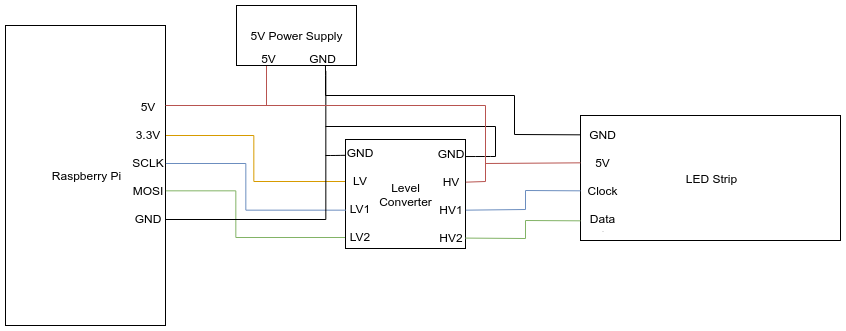
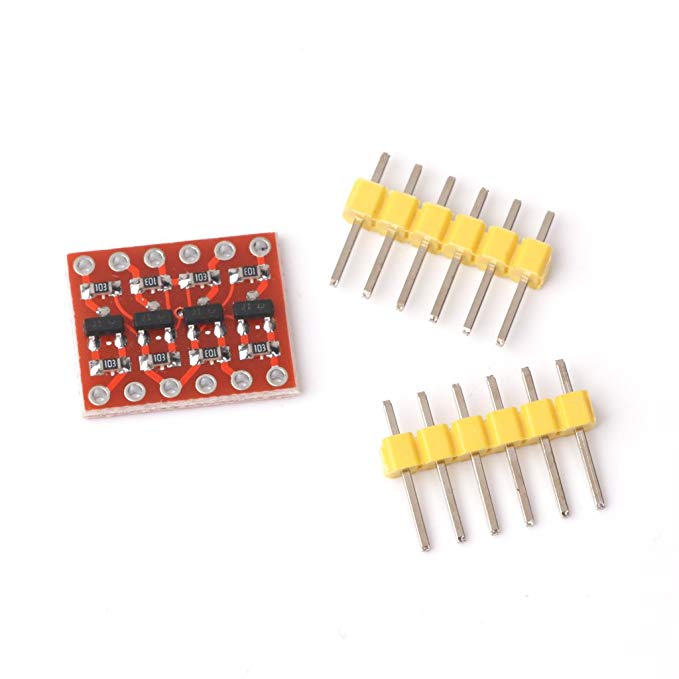
The level converter is necessary because the Pi communicates with 3.3V, and the LEDs with 5V. It simply converts the low voltage (LV) 3.3V signals from the Pi to higher voltage (HV) 5V signals.
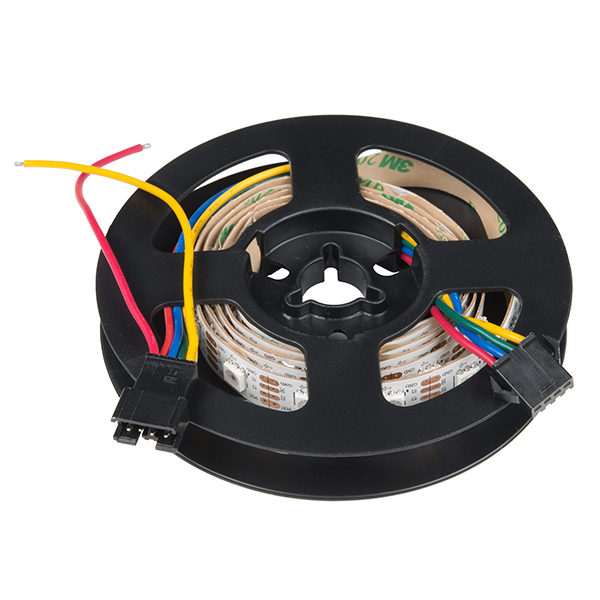
The LED strips themselves simply need a clock input, data input, five volts supply and ground.
Installing libapa102
To program the LEDs I downloaded GitHub user DirkWillem’s C library for APA102 LEDs. To install the library I cloned it in my visualizer folder:
Next, I turned on SPI, the protocol that the LED strips use. To do so I ran sudo raspi-config, selected Interfacing Options, and then selected SPI.
To test the library, I moved into the repository folder, made the examples, and ran one:
Improving the Visualizer
I added lights with the help of the libapa102 docs, and switched to using the beat-detection algorithm detailed here. The full new files are simple_visualizer.c, moving_average.c, and moving_average.h. I’ll just explain the update_lights and has_beat functions, and the moving average code I’ve written.
Function update_lights sets the LEDs to some shade of blue. If a beat is detected the blueness is set to full intensity, otherwise the lights decay until they are off. The decay effect ensures that short, abrupt beats are still visible, and is much better than a simple scheme where the lights are always full brightness or off.
Function has_beat uses a moving average to find beats. If the volume of a sample is above the average by a certain factor (I chose 1.3), then there’s a beat. This is more accurate than having a constant volume threshold for beats, as a song might have a quiet section that nonetheless contains beats.
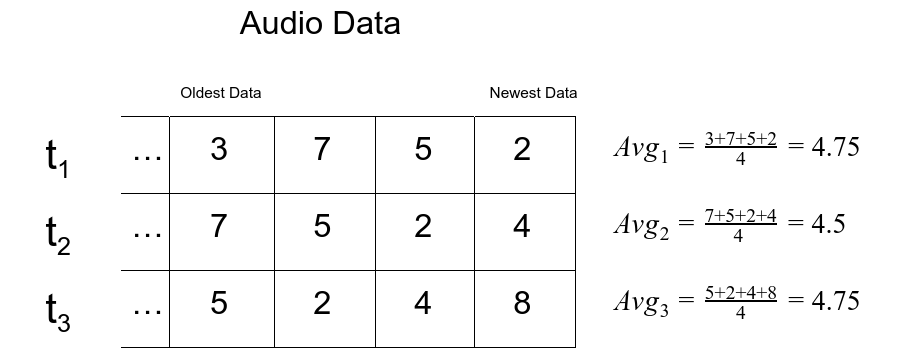
Now I’ll explain how my moving average code works. One way to calculate the moving average of the volume is to store the most recent n volume data points, and average them at every time step. Below I show three steps of a moving average that uses four data points. Note there’s only a beat at t3, as that’s the only time that the volume is significantly larger than the average.
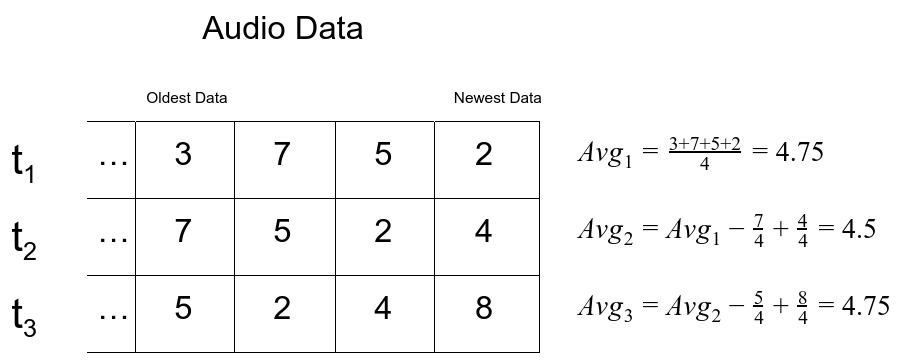
The above method for calculating a moving average is fine, but a bit slow. Notice that the sum for the average does not change much from step to step. The only difference is that the last term is thrown away, and a new term is added. We can use this fact to make calcuating the moving average a bit faster:
Writing a Makefile
A Makefile contains build instructions, and is run using make. By only building out of date files, a Makefile makes building projects much faster. Writing a Makefile also means compile commands don’t have to be memorized. This is the file ~/visualizer/Makefile I created for this project:
Each non-indented line is of the format target: prerequisites. The indented commands underneath, called recipes, dictate how the target is made from the prerequisites. If any prerequisites are missing, the targets corresponding to them are created first. If a missing prerequisite has no target, the build fails. The first target is created first.
For this Makefile, visualizer is the first recipe. If simple_visualizer.c or moving_average.c don’t exist, the build fails. Files ending in .a are library files, so if library file libapa102.a exists, visualizer is compiled.
If library libapa102.a doesn’t exist, the libapa102.a target will be built. This is done with the ar command for creating archives. The exact meanings of the flags rcs can be found in the man pages. Note that in a Makefile recipe $@ gets replaced with the target, and $^ with a list of the prerequisites.
Testing and What’s Next
After running make in the folder ~/visaulizer, I ran it with ./visualizer. Then I connected my phone and tried it out. Here are the results:
The moving average is sometimes slow to react to volume changes in the song, but usually catches up pretty well, making for some pretty good visualization. In the next post, I’ll work on making this setup more mobile, with batteries and perhaps even charging.
Parts
-
Logic Level Converter - You’ll want one to communicate between the Pi and LEDs. You can get this one for about $3.
-
APA102 Addressable RGB LED Strip (1x) - For the visualizations. I got two of these for $15 each, but one should be fine. If you get a different version of LEDs, make sure they take 5V, and that whatever communication protocol they use will work with the Pi.
-
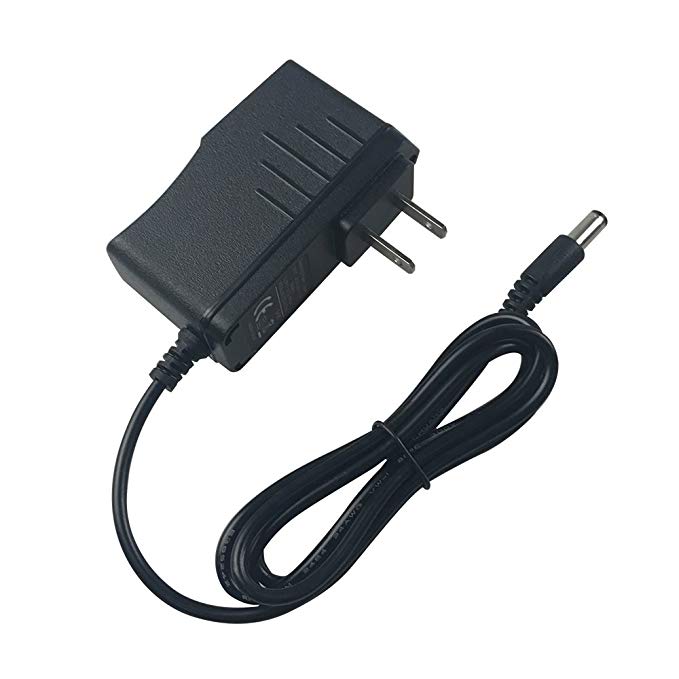
5v Power Supply - I happen to have an adjustable power supply, but you can also buy a wall charger that outputs a fixed 5V for about $7.
Parts Total: ~$25
| Back to Project |
Get occasional project updates!
Get occasional project updates!